Plan
Gantt chart

Gantt chart offers a comprehensive visual presentation of the workshop production schedule - operations are represented by rectangles.
Different colors show additional information and Insights
- Blue: operation without alerts.
- Red: operation is causing a delay, either for a call-off or another prodction order
- Orange: there are missing components (material shortage) for this operation
- Polka-dot pattern: unreleased orders
- Gray: inactive shifts, during which no parts will be produced
- Hatch pattern: tool changeover
- Semi translucent with polka-dot pattern: planned orders
- Translucent: historical data
Different types of insights shown or hidden by selecting them in the drop-down menu “Show insights”.
Historical data on the timeline can be shown or hidden. If history is shown, the current time is indicated by a dashed vertical red line. Historical data is represented by faded colors, and downtimes are marked with red triangles.
Clicking on the line title will redirect to Microplan view for this line.
A tooltip shows additional information (place the mouse cursor over an operation):
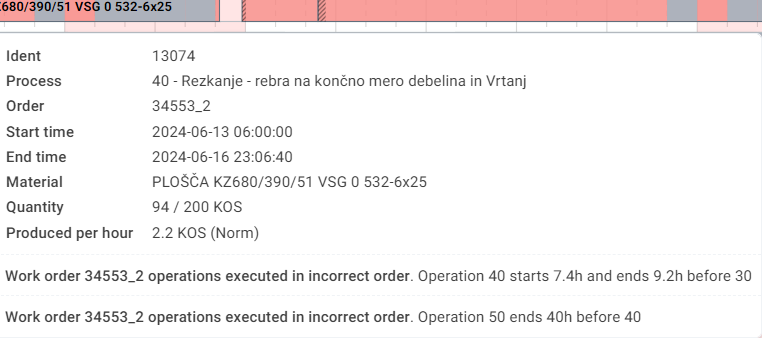
Click on an operation to open Order details window:
- Operations
- Bill of Materials (BOM)
- Productions
- Edit comment the operation comment
- Requirements button will display a current MRP list of stocks requirements for the selected material (SAP only)
- Technical details provides a more detailed overview of the details of the order

Microplan
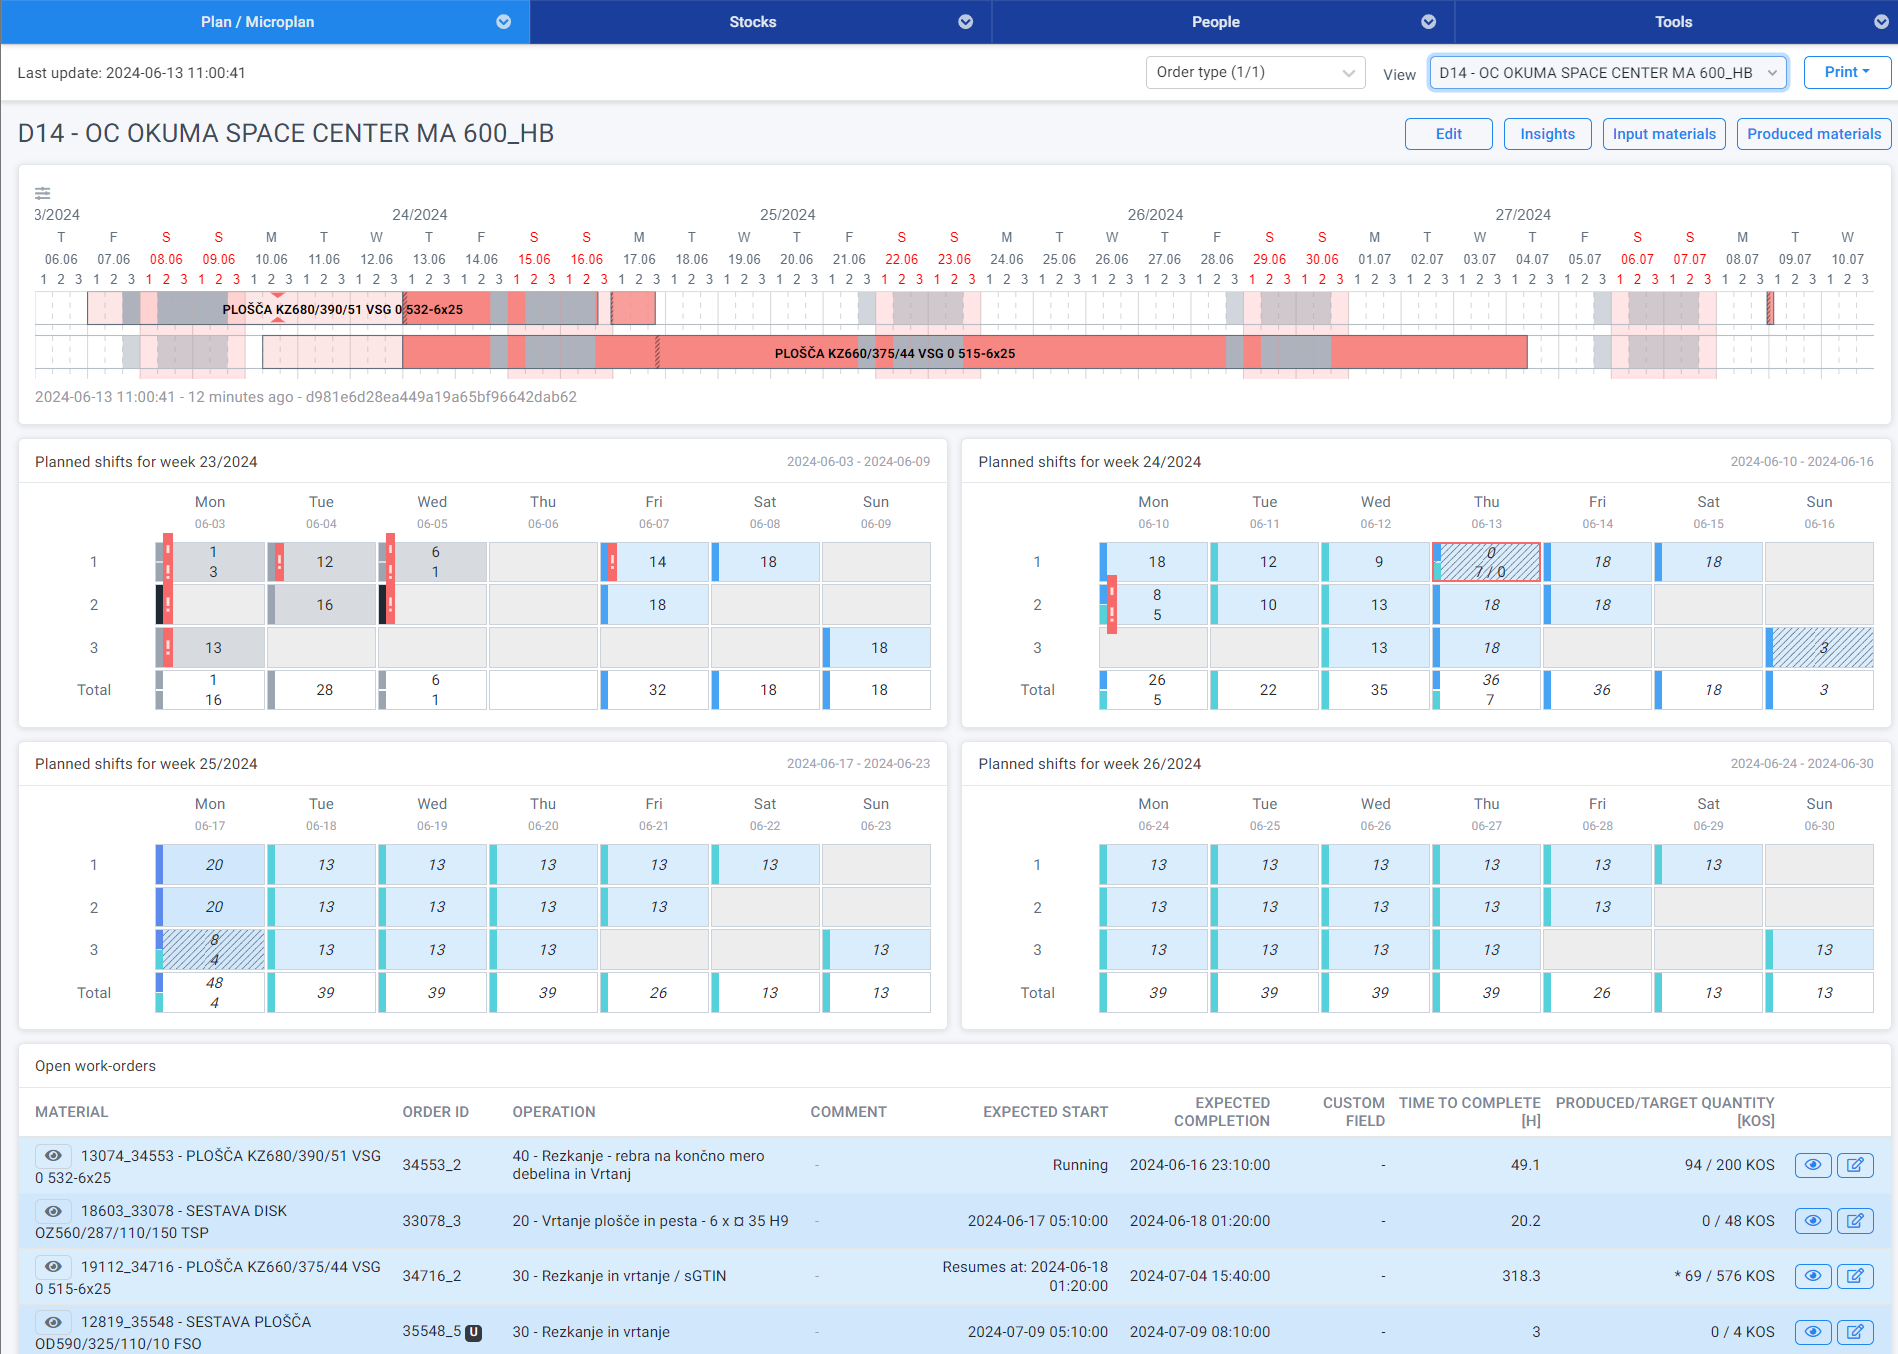
Microplan view shows detailed information on production line level.
Shifts table
Shift tables show produced or predicted quantities for each shift.
- Red exclamation marks indicate downtimes.
- Hovering the mouse over them will display additional information.
- Hatch pattern indicates that tool changeover is planned in this shift.
Open work orders list
A detailed list of open work orders. Columns can be added or removed in Linegroup settings. Unscheduled operations can be either hidden or displayed at the end of list.

Edit operation
Edit (pencil icon) next to the detail icon (eye)
Edit button opens a modal window for editing the operation where you can edit:

- Capacities: Manually set the expected percentage of operation normative. A value less than 100 will make the duration longer than the normative. A value higher than 100 will make the duration shorter.
- Unscheduled: Deallocate the operation from the production line. (Not available if scheduled statuses are imported from ERP.)
- Ignore: LEAP will not consider this operation when simulating forecast and it will not be shown on the Gantt chart. It can be accessed and restored via Microplan.
Edit line

Each production line can be edited by clicking the Edit button. Orders and shifts view will be displayed. See section Orders and shifts
What-if analysis
What-if analysis can be made to simulate different scenarios. After making adjustments to orders and shifts, a quick simulation can be shown below the shifts grid by clicking on »Quick Calc«.
This can be repeated multiple times to show and compare different scenarios, shown as additional Gantt charts:

Plan changes
Plan changes display a list of notifications and alerts for selected production line, sorted by date and shifts:
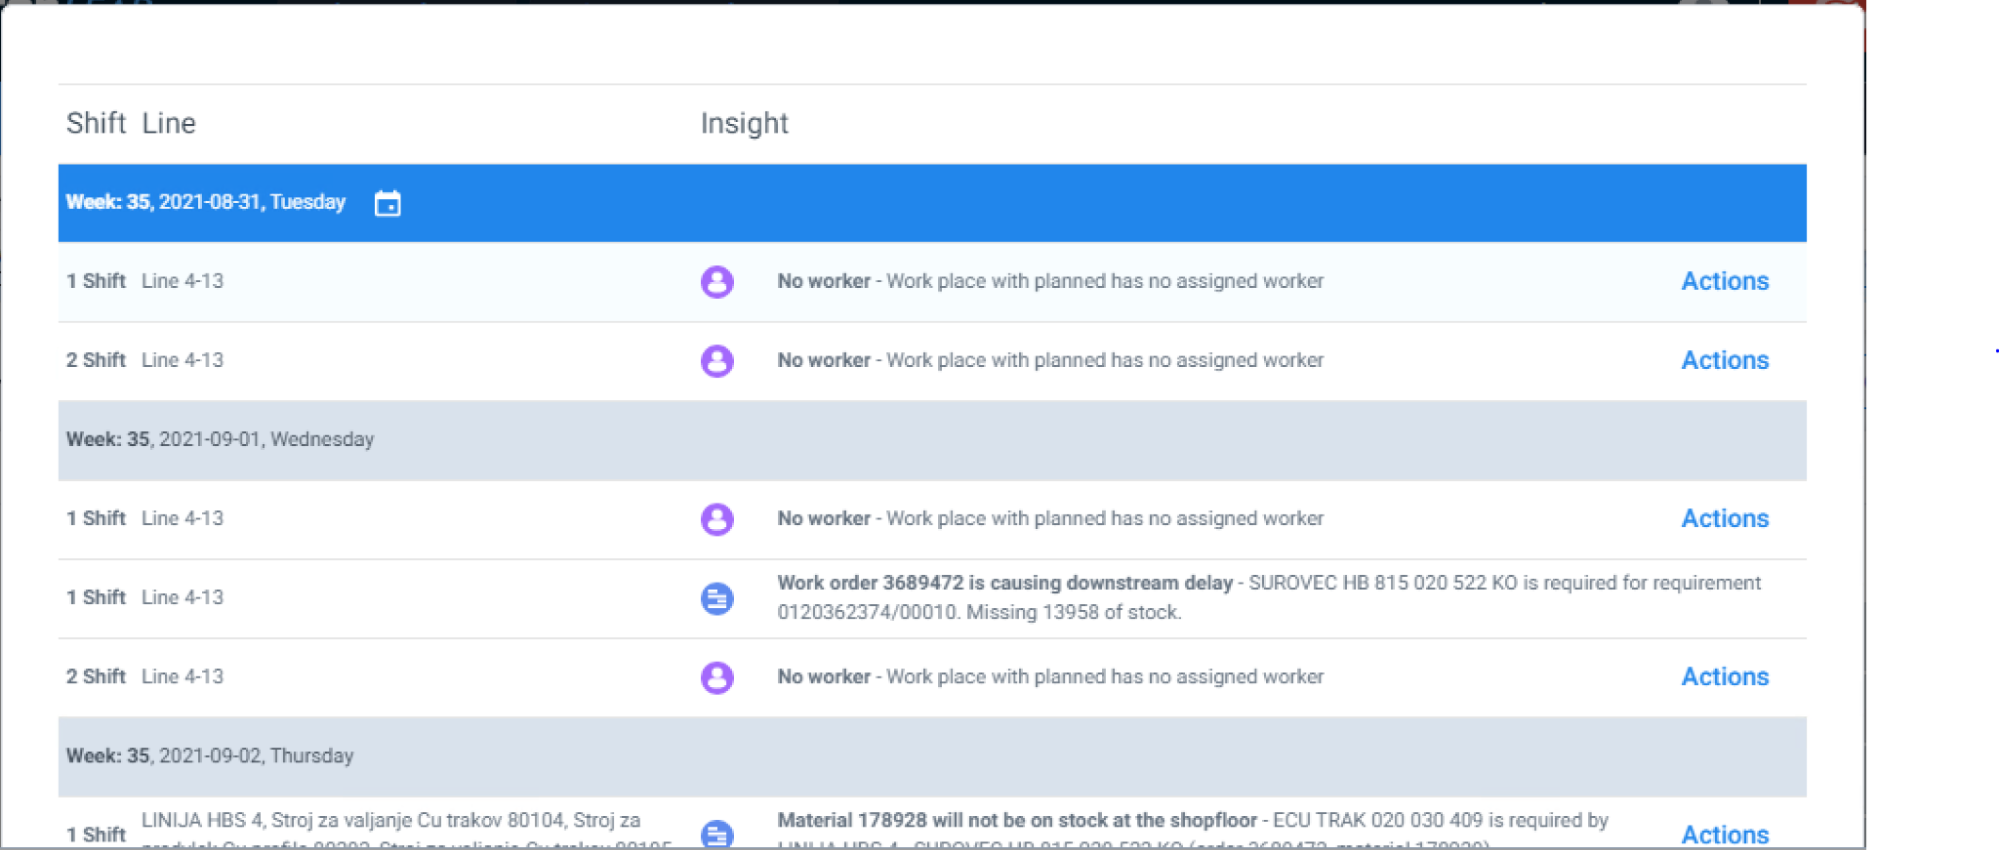
Qlector LEAP suggests possible actions to resolve each insight:

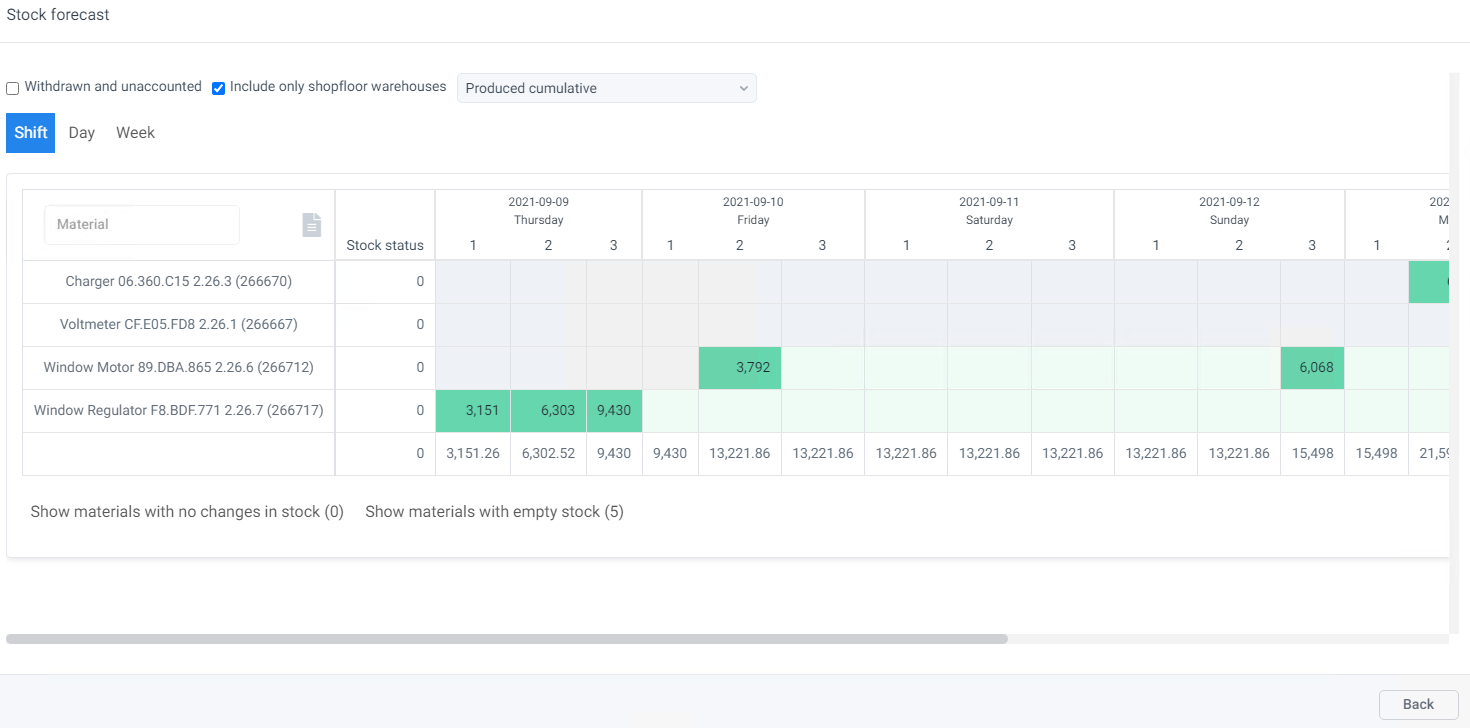
Input materials
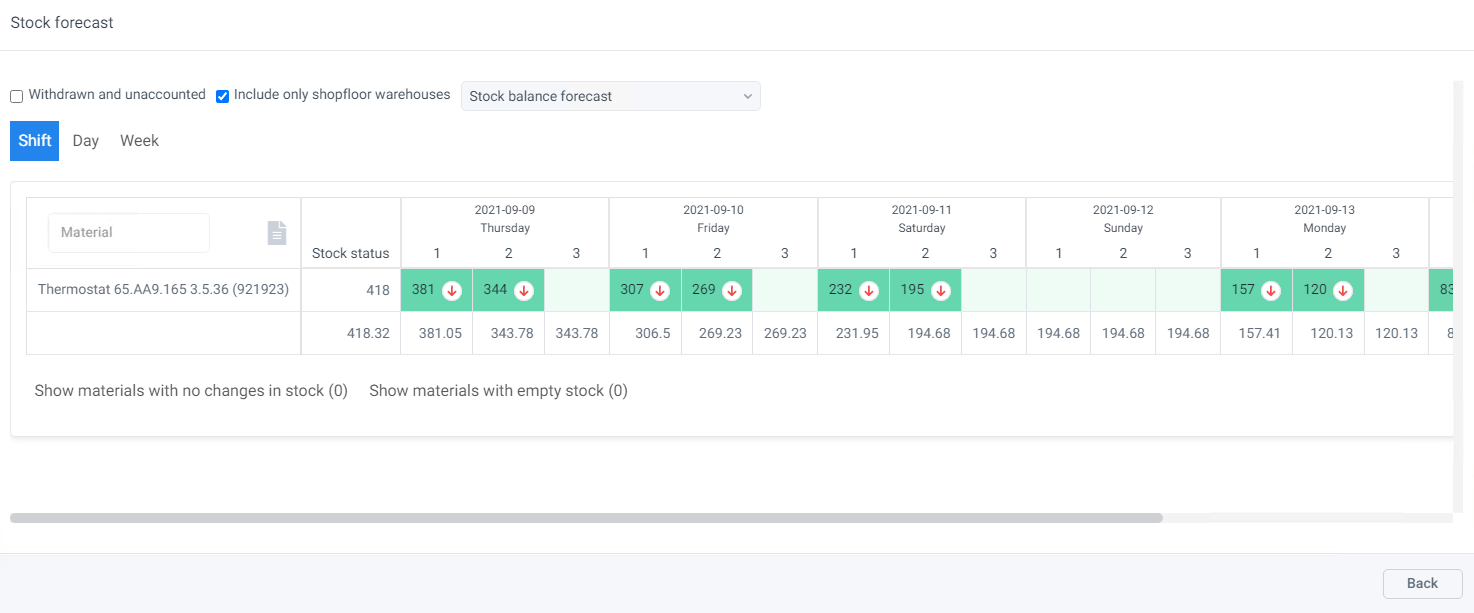
A modal window is displayed, showing the Stock forecast view for Input materials on the selected production line. See Section Stock forecast.
Produced materials
Produced materials view is displayed the same way as Input materials:
Orders and shifts

Display open work orders and shift calendar of production lines:
- Shifts can be closed or opened by clicking on them.
- Operations can be edited: see Microplan -> Edit operation
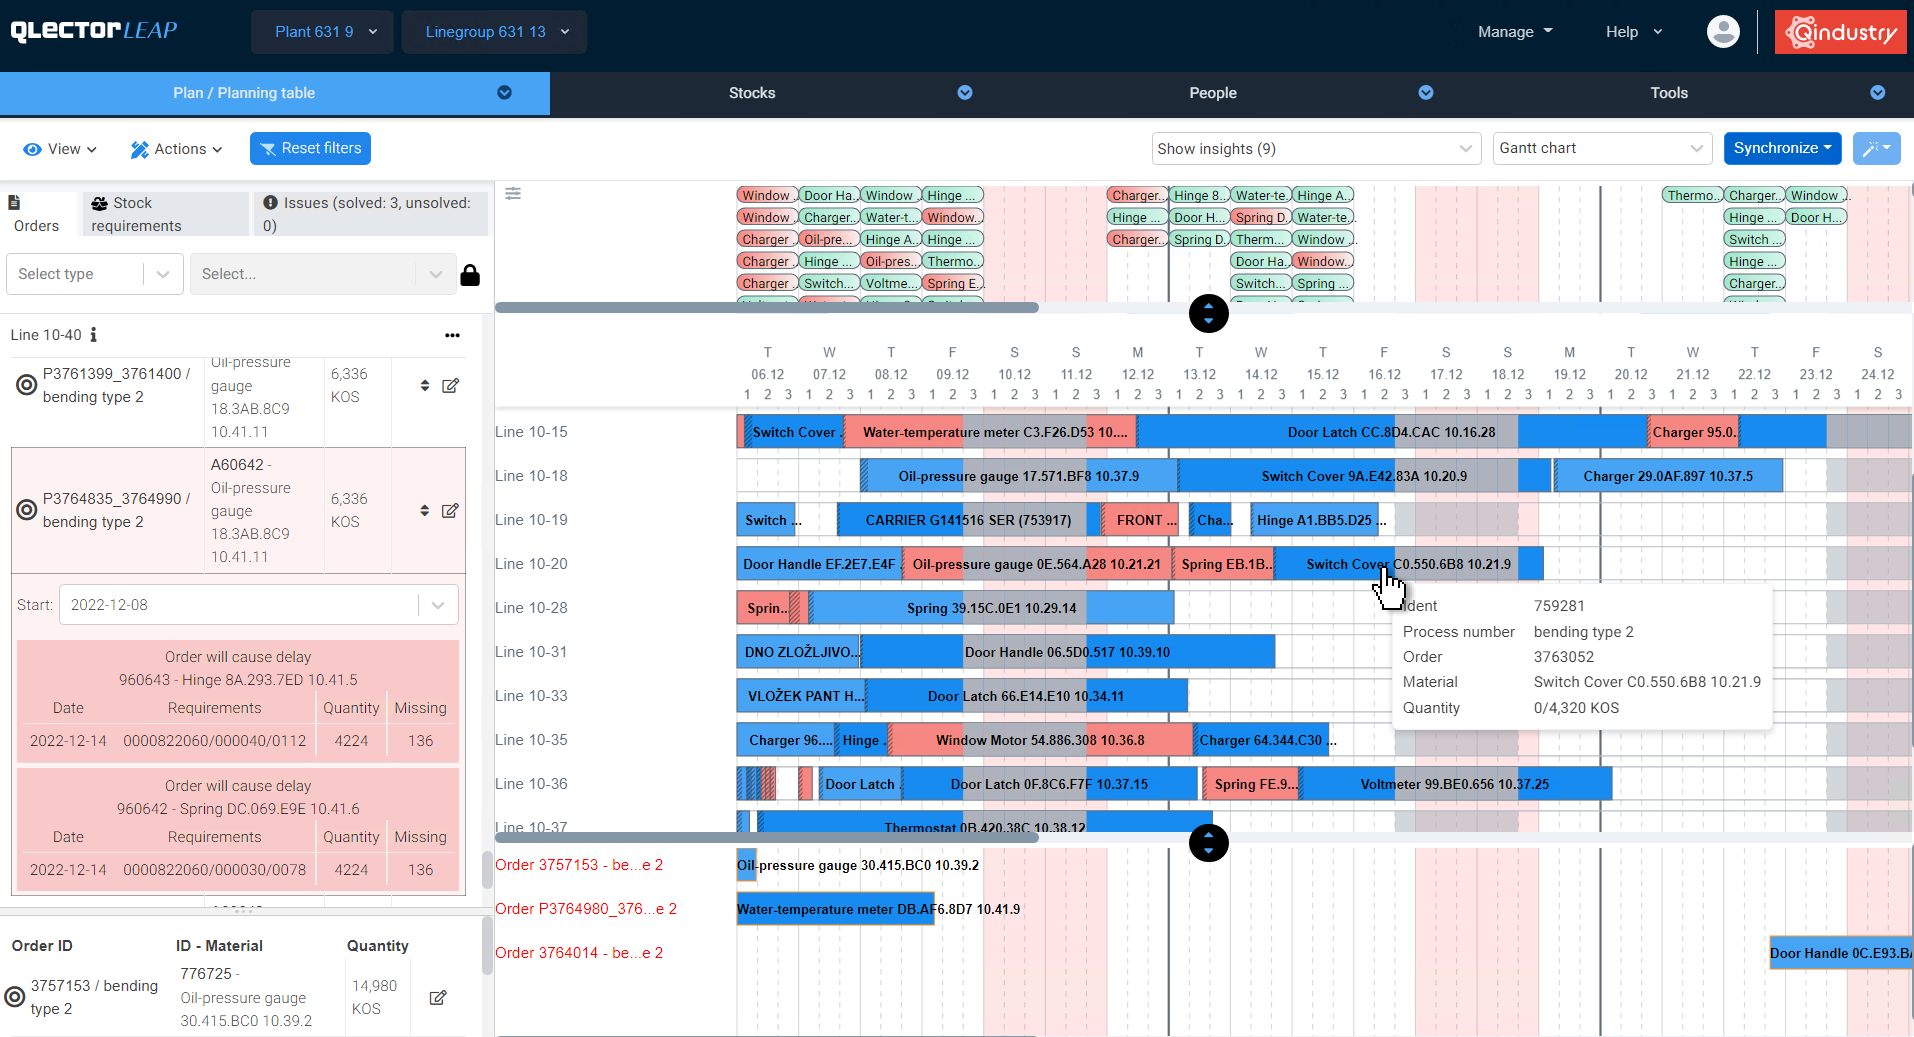
Planning table
Planning table is used for detailed scheduling of planned and production orders. Each operation (process) of an order is represented by a rectangle. Position the mouse cursor on each operation to show a tooltip with basic information, insights and optional comment.
Drag&drop reschedule
Click on an operation to select it. Automatic filter (if not disabled) will hide unrelated production lines. The cursor then changes shape to move mode and you can use drag&drop to reschedule the operation.
Insights
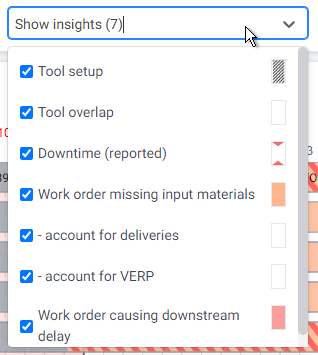
Various of insights can be displayed or hidden from the planning table. You can enable or disable them on the dropdown menu Show insights. They will show on Gantt chart as colors, and also in the left menu.
- Tool setup: Show hatch pattern where changeover is required
- Work order missing input materials: show which orders are missing input materials
- Allow usage of safety stock: does not show insight, if stock is below safety stock level, but above 0.
- Account for deliveries: take into account only quantities currently on stock, or also quantities in future deliveries
- Account for VERP
- Work order causing downstream delay: show which orders will not meet the demand on time (independent and dependent requirements)
- Operations excecuted in wrong order
- Freeze order move: shows insight if a frozen order is not in its frozen position
-
Order partially scheduled: some operations of this order are not scheduled yet
- White with red exclamation mark: the order extends past the simulation horizon and it’s end time is not known. Insights can not be generated for such orders.
Operation menu
Control+click on an operation opens the operation menu:
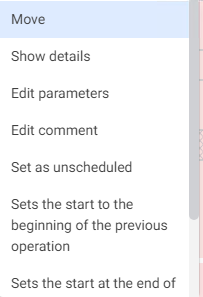
- Move: opens a dialogue for moving an operation instead of using drag/drop
- Show details: displays a window with detailed information about the order and an button to show requirements for selected material
- Edit parameters: Quantity and capacity can be changed. Capacity can be saved to LEAP, and quantity can be saved to SAP for planned orders only.
- Chunk operation: operation can be split into smaller chunks, each of which can be scheduled separately. In ERP system the operation is not chunked, so it takes the start of earliest chunk and finish of the last chunk.
- Edit comment: Enter or edit a short text. The comment will be diplayed in operation tooltip, in the left menu, in operation details and in microplan view
- Set as unscheduled: the order will be unscheduled from this line and put in a pool of unscheduled orders
- Freeze work order: automatic planning will prioritise frozen order to finish on their frozen dates. If the end time changes, an insight can be displayed.
- Ignore operation/order: moves an operation (or all operations of an order) to Ignored tab. It is no longer visible in LEAP except in a list of ignored operations on a tab in the left menu of the planning board. Ignore is used when such operations can not be immediately closed in ERP system, but are not suitable for planning. Such operations can also be moved back to active status manually.
- Fix on line: automatic scheduling will not reschedule this order to other lines
Left menu
Left menu is available if View -> Show left menu is selected. It displays a list of production lines and operations and detailed information.
-
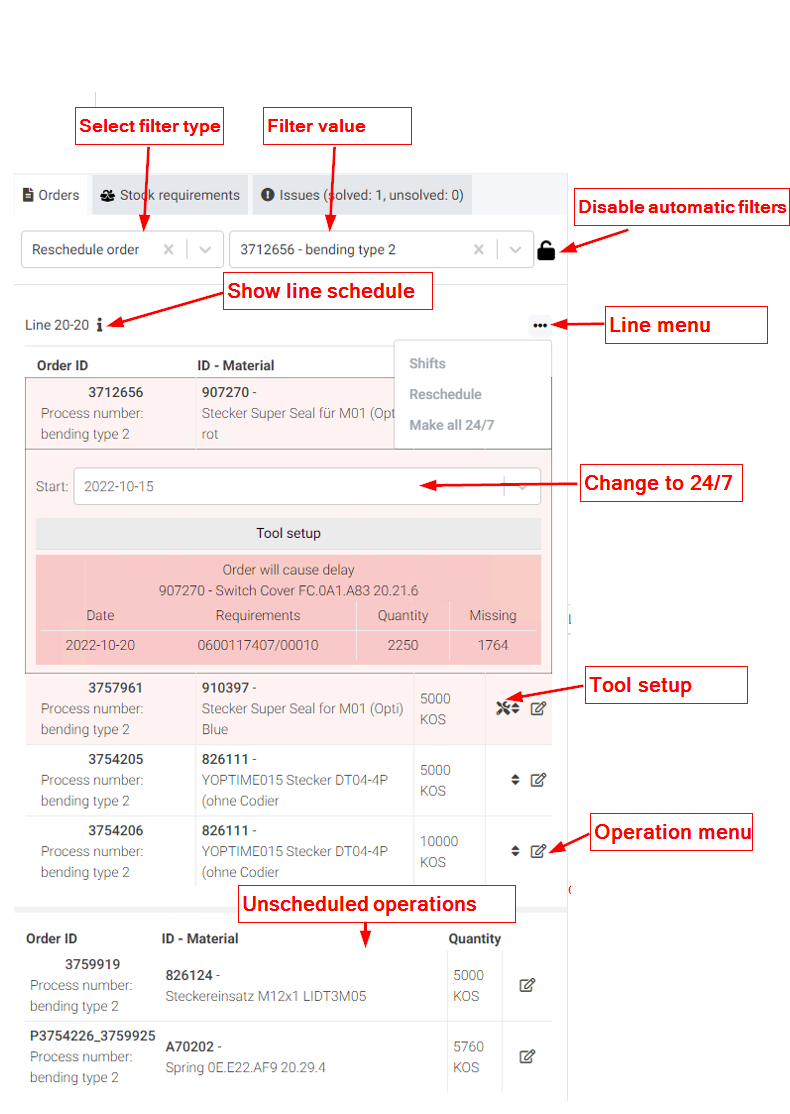
Orders tab shows production orders in more detail. The tool icon indicates the an order will require tool setup. Clicking on an order displays additional information. In case of delays, the affected call-offs are listed along with their dates and quantities.
-
Stock requirement tab shows a list of independent stock requirements (sales orders, call-offs…). This tab is enabled if View -> Show stock requirements is selected.
-
Issues tab will show new and resolved issues, which occured as a result of rescheduling orders. Issues that arise in other dependent Linegroups are also shown.
Automatic filters
The display on the planning board is automatically filtered each time an operation is selected:
- hides production lines on which this operation can not be scheduled
- displays related production lines from other Linegroups
To disable automatic filtering, activate the **lock icon.
Manual filters
Filters are used to find specific work orders, or to assist with the scheduling. First select a filter type from the drop-down list and then enter the value(s). Some types allow multiple values.
- Lines: show only selected lines
- Work orders: highlight selected operations
- Materials: highlight selected materials
- Reschedule order: highlight selected operation and show possible production lines
- Reschedule on line: show only operations that can be scheduled on selected line
- Parent order IDs: Show all operations that constitute the final product order
Lines & operations
- Clicking on the “i” in the left pane displays details of the operations and any changes made after opening the planning table
- Line menu:
- Shifts: Edit shifts of the line with instant planning table simulation
- Set all operations on a line to 24/7 mode: push all operations to the left
- Drag and drop orders to change the order of operations
Rescheduled Stock forecast and tool changes
Changes to the schedule are not visible in other tabs, such as microplan or Stocks/Stock forecast, until the schedule is saved to ERP and synchronized again to LEAP. To see the Stock forecast,based on current situation on the planning table, you need to switch to Stock forecast view inside Planning table. This is also true for Tool changes view. Both views can be selected from the drop-down menu. Additionally, KPIs can be displayed to compare two different schedules.
Automatic planning
- Magic wand: Qlector LEAP will calculate the best possible production schedule based on the parameters and criteria set. For more information on automatic planning, please see section Automatic planning
Saving to ERP
-
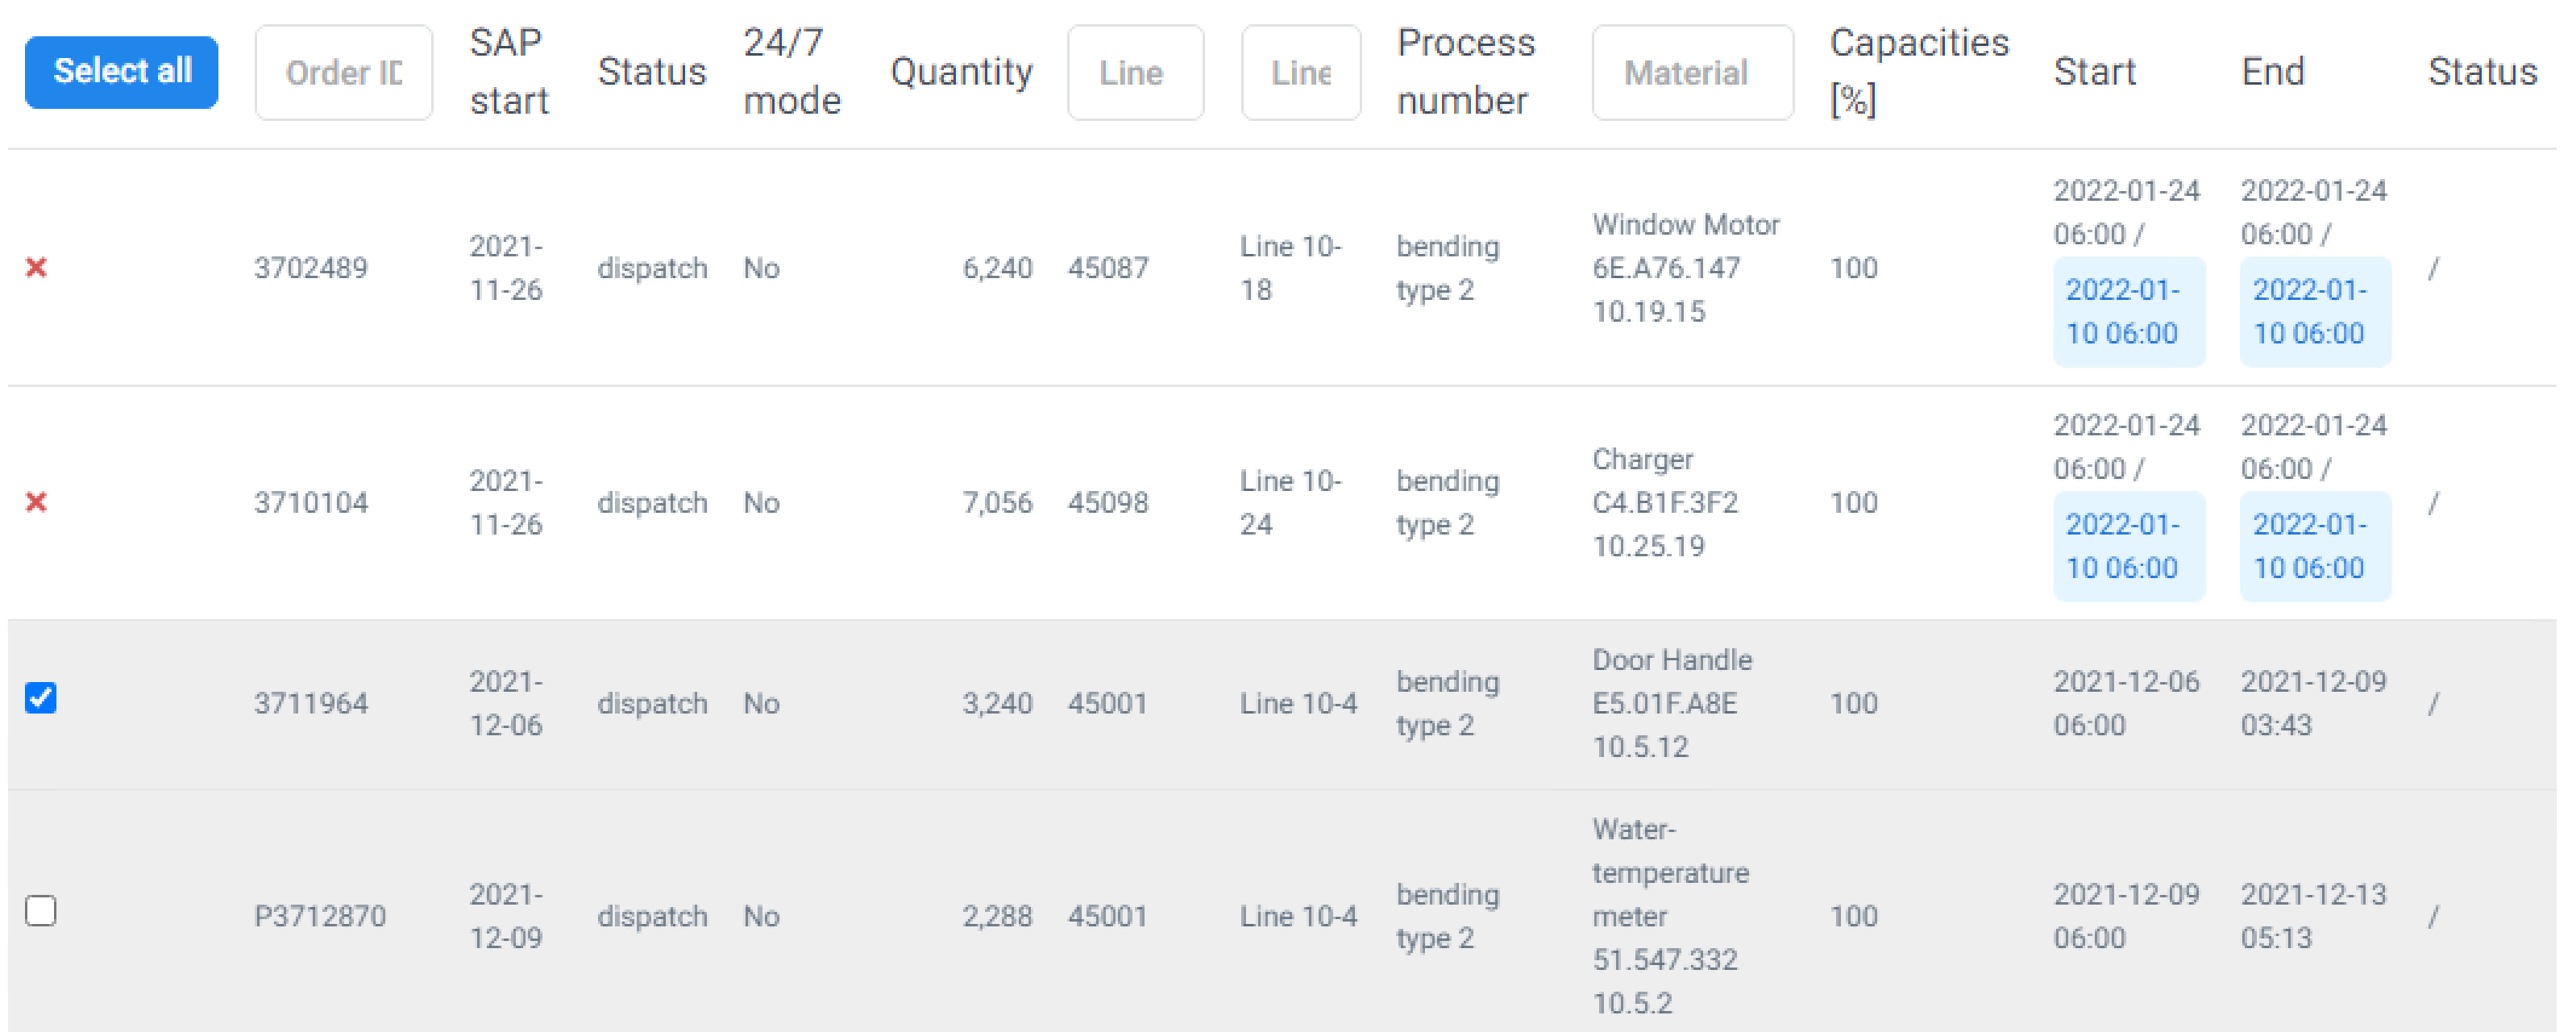
Synchronize and refresh: opens a modal window, where changes can be reviewed before saving to ERP.The new plan can be saved, or only the shifts. The plan can also be exported to SAP (Synchronize and refresh). Operations that can not be saved are marked with a red “x”, and differences after scheduling are highlited.
-
Plan changes
A list of the wollowing changes is displayed:
- Work order quantities
- Work order Start and end dates
- Shifts

Plan Insights
Displays a list of all insights for the selected workshop:
 Clicking on an insight redirects to Microplan view of the affected production line.
Weekly realization
Information on production realization is shown for a selected week:
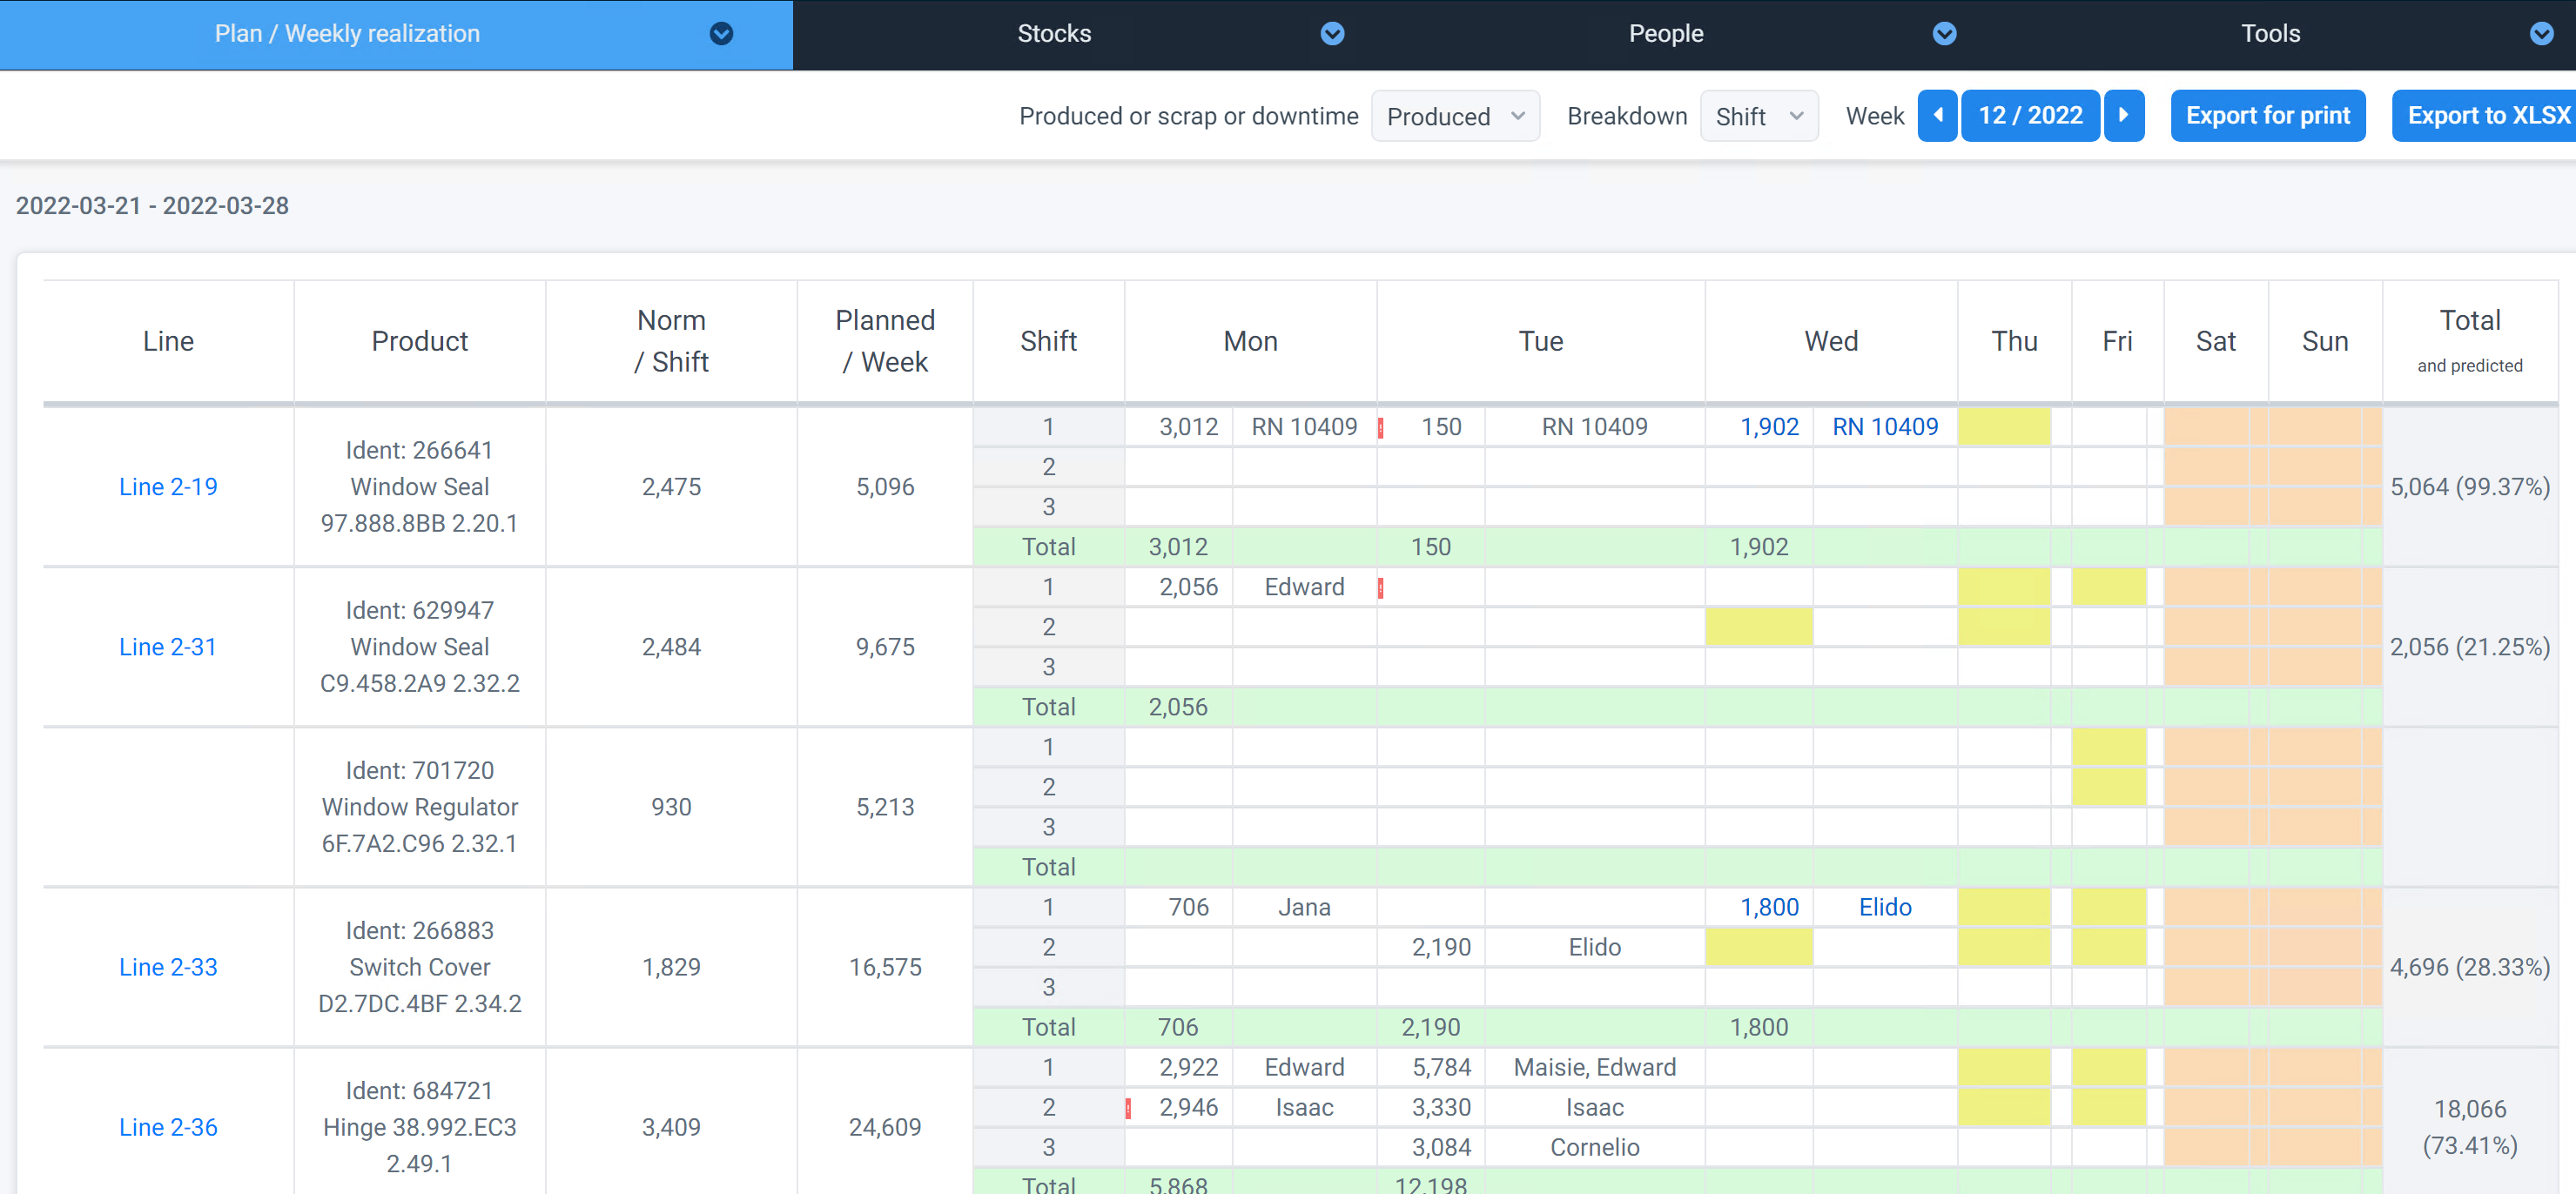
The data display can be broken down into week, day or shift time buckets for a more detailed view. Also, different type of information can be selected via drop-down menu:
- Produced quantity
- Scrap quantity
- Downtimes
Clicking on an entry will display additional information about that shift.

The report can be exported for print (opens in a new browser window) or as an Excel file.
Downtimes
A list higher-than-expected downtimes is displayed. A larger quantity of information is needed for these insights, so they might not be available for some time after including a production line in LEAP.
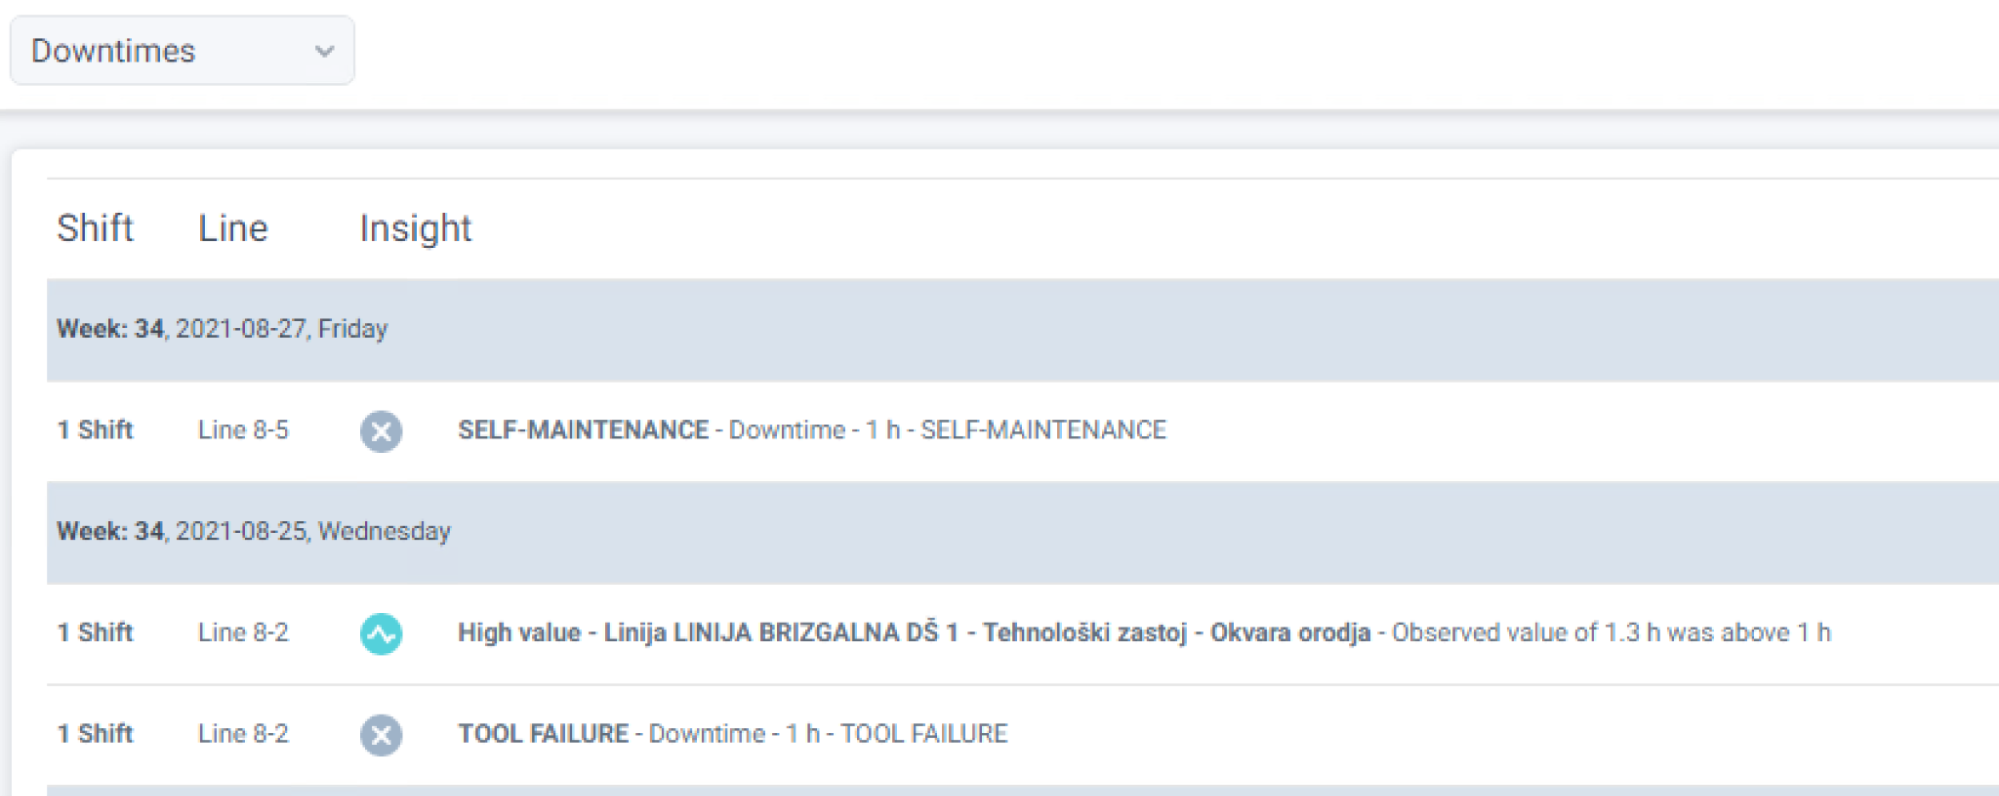 Clicking on a row will show additional information.
Scrap
A list of all insights about higher-than-average scrap is displayed:

